Trace first real time agent analytics: Australian teams' CI gates
Trace first capture, CI gates, and audit ready telemetry: a practical playbook for real time agent analytics practitioners, hosted and audited in Australia.

Real-time agent analytics means live traces, per-conversation evaluations and SLO-driven alerts that track what your AI agents actually do, not what you hope they do. The immediate priority for any enterprise rolling out conversational AI is switching on complete, replayable traces of every input, model call, tool call and output. That single move gives you latency p95 measurement, resolution rate tracking, hallucination detection and a proper diagnose-and-fix loop from day one.
TL;DR:
- Complete trace capture, including session ID, timestamps, agent details, model calls, and tool invocations, is essential for accurate monitoring and troubleshooting.
- Blocking deploys should focus on regressions in task completion, hallucination rates, or PII leaks, with latency targets under 800 milliseconds at p95 over a five-minute rolling window.
- Instrumentation must follow a specific order: emit traces, label for attribution, stream to analysis, evaluate, and turn failures into regression tests before production.
- Audit readiness requires detailed metadata, immutable storage, and fast hot indices to answer key questions about who, what, when, why, and which tools were involved in each interaction.
- Using a trace-first observability model improves agent reliability by providing operational guardrails that support rapid diagnosis, targeted fixes, and compliance at scale.
Table of Contents
- Observability first: traces, spans and the data model you need
- What metrics actually matter, and which ones should block a deploy?
- How do I instrument an agent pipeline end to end?
- What does an audit-ready agent record need to include?
- Turning alerts into fixes: the ops playbook
- How Conversational AI’s platform implements live agent analytics
- Why trace-first analytics matter as agents gain autonomy
- Get private, audit-ready agent telemetry without building it yourself
- Sources
- FAQ
Observability first: traces, spans and the data model you need
You cannot analyse what you did not capture. That’s the whole problem with agent monitoring built after the fact: teams try to reconstruct behaviour from partial logs and end up guessing. Trace-first observability flips that. Every model call, tool invocation and decision gets logged as it happens, so you can replay and evaluate conversations rather than reconstruct them from memory.
A usable trace needs a specific set of fields, not a generic log dump:
- Session ID and RFC3339 timestamps with millisecond precision
- Agent ID and version, so you can attribute behaviour to a specific build
- Model call details: model name, token counts, latency per call
- Tool calls with their parameters and return values
- Retrieved context identifiers (which documents or records fed the answer)
- Final output plus any redactions applied before storage
The architecture matters as much as the fields. A proxy-primary capture pattern, where a proxy sitting between the agent and its channels writes the record, protects against an agent altering or dropping its own trail. SDK enrichment layered on top is fine for extra in-process detail, but the proxy should remain the system of record for anything tamper-sensitive.
For accurate latency attribution, break each conversation into a root span with children for llm.duration_ms, retrieval.duration_ms and tool.duration_ms. Without that decomposition, a slow retrieval call and a slow model call look identical in your p95 numbers, and you’ll chase the wrong fix.
Sampling policy keeps this affordable. Run deterministic inline checks (format validation, PII pattern matching) at 100% coverage, since they’re cheap. Reserve expensive LLM-judge rubrics, the kind that score coherence or groundedness, for a 5 to 10% sample with async evaluation.
Pro Tip: Store the retrieved context IDs even when you can’t store the full retrieved text. You’ll need them to reproduce a hallucination case six months from now, and re-running retrieval against a changed knowledge base won’t give you the same answer.
What metrics actually matter, and which ones should block a deploy?
Not every metric deserves the same urgency. Some should stop a release in its tracks; others should just show up in next week’s trend report. Treating them all the same is how teams end up either paging on-call at 3am for a KPI wobble, or shipping a regression because nobody gated on it.
Group what you measure into four axes:
- Outcome: resolution rate, task completion
- Quality: hallucination rate, groundedness, task accuracy
- Operational: latency p95, cost per resolution
- Business: CSAT correlation, return on automation spend
Then map each metric to its duty cycle. A composite framework that blends understanding, reasoning and delivery is genuinely useful here, because no single number captures interaction quality on its own.
Duty-cycle split: CI gates block deploys on task completion regressions, hallucination spikes and PII leaks. SLOs page on-call when latency p95 or escalation accuracy breach thresholds in production. KPIs like conversation coherence and context retention trend weekly for product review rather than triggering alerts.
Set voice latency targets at 800 milliseconds or under, and measure p95 over a rolling 5-minute window rather than a daily average, which hides spikes. For resolution rate, a healthy range for resolution rate is typical for most deployments, with elite implementations achieving higher rates.
A composite score earns its place on an executive dashboard, but keep the decomposed metrics and an Error Feed alive underneath it. Engineers diagnosing a specific failure need the individual numbers, not the blended one.
How do I instrument an agent pipeline end to end?
Wiring live analytics into a production agent pipeline follows a fairly predictable order. Skip a step and you end up with a dashboard that looks complete but has gaps exactly where you need detail most.
- Emit traces from every agent action. Model calls, tool calls, retrievals and final outputs all get a span, with correlation IDs joining every step of a multi-turn workflow.
- Label jobs for cost and attribution. Tag each trace with channel, campaign or business unit so cost-per-resolution reporting doesn’t require manual reconciliation later.
- Capture CSAT as a span attribute, not a separate system, so satisfaction scores stay joined to the exact conversation that produced them.
- Stream traces to a real-time ingestion layer, then land them in a columnar warehouse like BigQuery for ad-hoc analysis at scale. Tools such as the BigQuery Agent Analytics SDK demonstrate this pattern well, offering trace reconstruction and an agent context graph out of the box.
- Run your evaluation pipeline: deterministic checks inline, LLM-judge scoring async, failures clustered into an Error Feed for root-cause analysis.
- Turn failing conversations into regression tests and apply the relevant metric gates in CI so the same failure can’t ship twice.
Reviewing how deployment pipelines handle staged rollouts helps clarify where these gates sit relative to pre-prod and production.
Pro Tip: Keep a hot index of recent traces separate from your cold warehouse storage. Auditors and on-call engineers both need fast lookups, and querying a full historical warehouse for “show me every conversation this agent had in the last hour” is painfully slow at enterprise volume.
What does an audit-ready agent record need to include?
Your audit and security teams will ask six questions of any agent record: who initiated it, what the agent did, when it happened, why it made that decision, which tools it invoked, and what data left the system. If your telemetry can’t answer all six on demand, it isn’t audit-ready yet, regardless of how good your dashboards look.

Practical guidance on this is specific rather than vague. A compliant audit record needs a defined minimum field set per event, captured through the same proxy-primary architecture used for observability. Async durable writes and batch sealing into immutable storage protect against tampering, while a queryable hot index keeps day-to-day auditor requests fast rather than forcing a cold-storage retrieval every time.
This matters more than most teams assume. Only 38% of organisations monitor AI traffic end to end, and just 17% continuously monitor agent-to-agent interactions, according to Cloud Security Alliance research. That gap is exactly where compliance failures hide.
| Oversight model | Human role | Typical compliance risk |
|---|---|---|
| Human-in-the-loop | Approves each agent action before execution | Lowest risk, highest latency cost |
| Human-on-the-loop | Reviews actions after execution, can intervene | Moderate risk, needs strong audit trail |
| Human-out-of-the-loop | Agent acts fully autonomously within guardrails | Highest risk, requires the most complete telemetry |
- Capture full metadata on every event, and be selective about payload retention rather than sampling logs wholesale.
- Session-level compliance checks, not single-message PII scans, are needed because prior consent and erasure requests change the compliance picture over the life of a conversation.
Turning alerts into fixes: the ops playbook
Telemetry only pays off once it drives action. A dashboard nobody checks is just a cost centre.
- Set alert tiers by severity. Page immediately on latency p95 breaches, hallucination spikes or PII leaks. Send daily or weekly trend reports for KPIs like context retention, which don’t need a 3am response.
- Cluster failures automatically. Grouping similar failing traces (an HDBSCAN-style clustering approach works well) turns a pile of individual errors into a handful of root-cause tickets your engineers can actually action.
- Gate CI on a small, deliberate metric set. Task completion, hallucination rate and PII leakage should block a deploy. Everything else belongs in the SLO or KPI tier, following the duty-cycle split rather than gating on every metric you track.
- Close the loop. Alert fires, you probe the specific trace, apply a targeted fix, then re-measure the same cohort of conversations to confirm the fix actually worked before moving on.
How Conversational AI’s platform implements live agent analytics
Some conversational AI platforms are built around a trace-first model that runs in a private, Australia-hosted cloud, so that voice, SMS, email and live chat traces stay under an organisation’s control rather than passing through third-party infrastructure. CRM integrations feed context directly into each trace, and built-in real-time analytics surface latency, resolution rate and audit fields without requiring a separate telemetry build.
Why trace-first analytics matter as agents gain autonomy
Trace-first observability is the strongest investment any enterprise team can make in agent reliability, and it’s the one most teams shortcut. Treat these metrics as operational guardrails, not vanity numbers on a slide. Run a four-week pilot with the duty-cycle split above: gate a handful of metrics in CI, page on SLO breaches, and trend the rest. You’ll learn more from that pilot than from another quarter of dashboard-watching.
— Sowrabh
Get private, audit-ready agent telemetry without building it yourself
Building the trace capture, storage pipeline and audit schema described above from scratch is months of engineering work most IT teams don’t have spare capacity for. Conversational AI gives you that infrastructure already wired in, hosted entirely within Australia so every trace, audit record and CRM interaction stays under local data sovereignty rules instead of routing through offshore infrastructure.
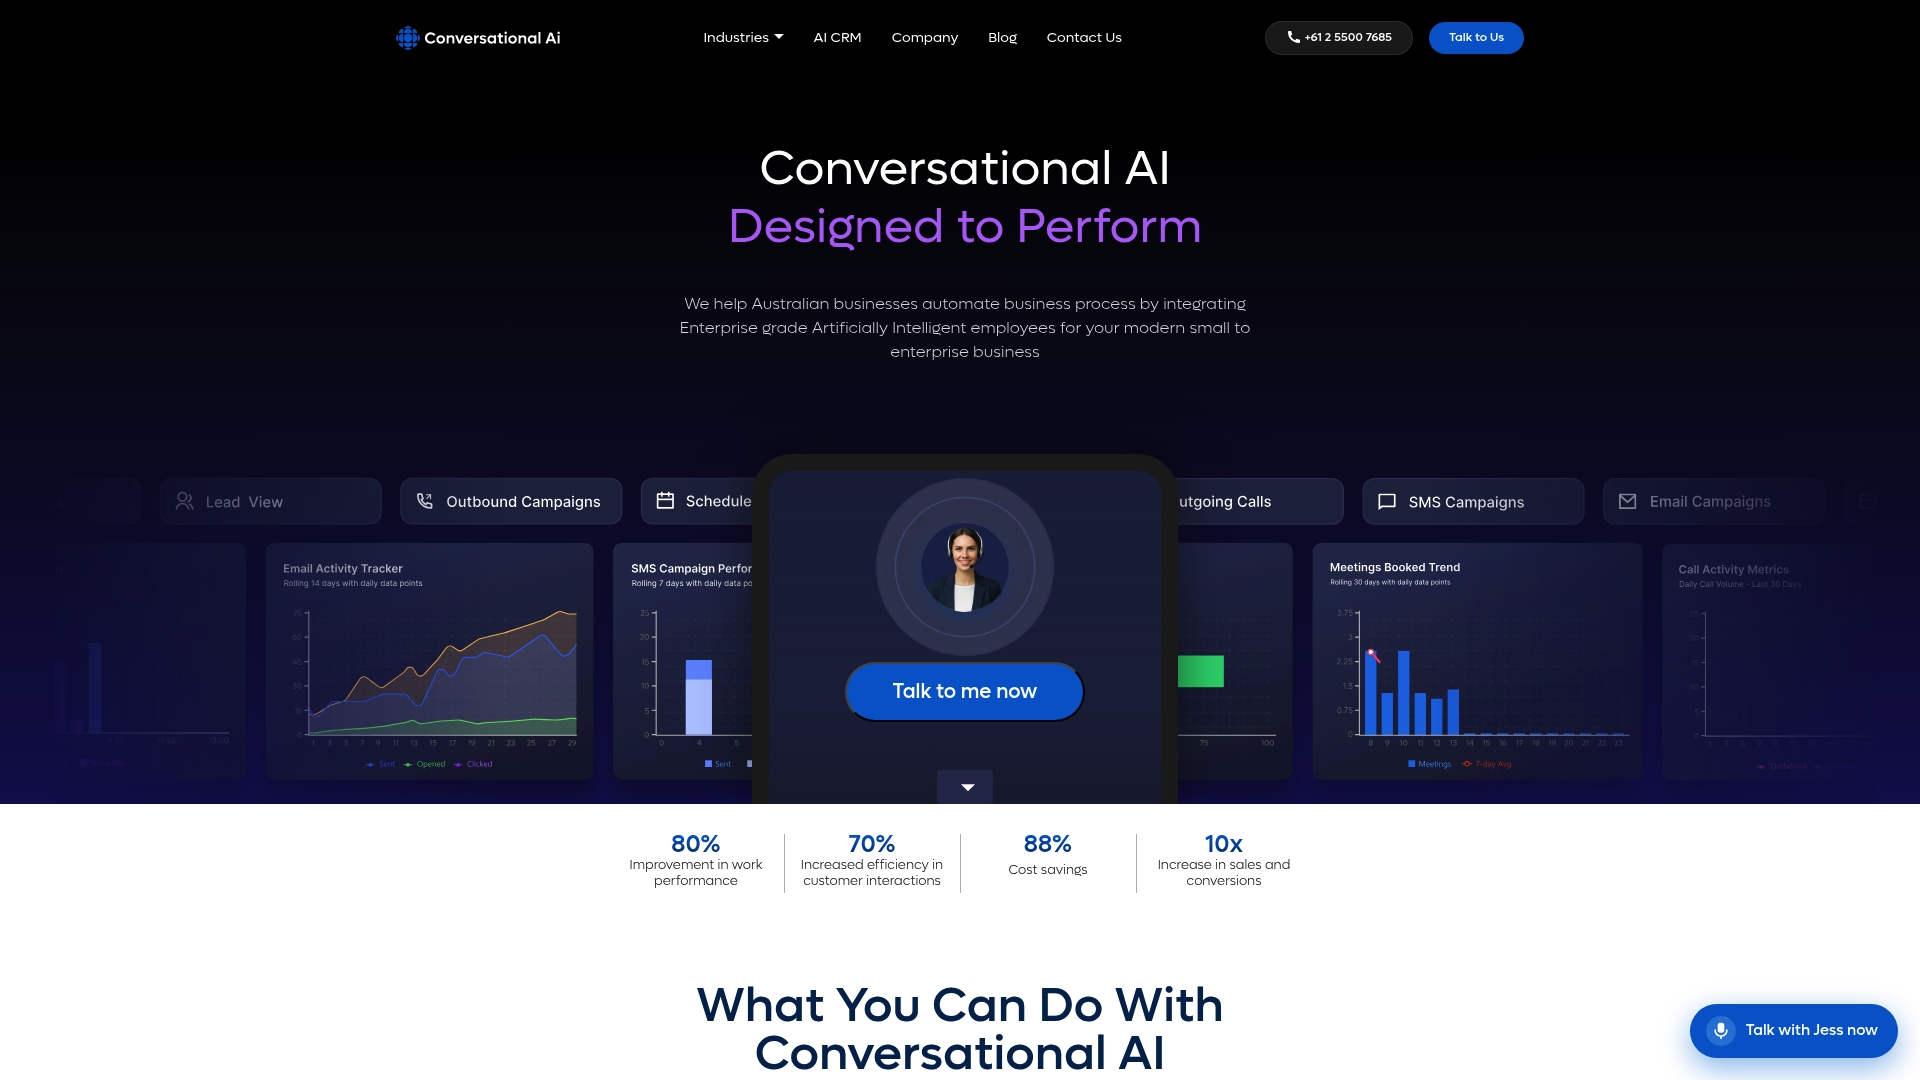
The platform’s real-time analytics cover the latency, resolution rate and audit-trail fields this guide walks through, across voice, SMS, email and live chat agents, integrated directly with your existing CRM. Teams building the operational side of this stack, including agencies running AI-driven client work, face similar measurement and monitoring challenges at scale.
If you’re weighing up whether to build this instrumentation in-house or deploy it, start with a practical integration checklist: confirm your CRM webhook endpoints, enable trace capture on a pilot channel, and set your first SLO thresholds before wider rollout. Request a demo of the Conversational AI platform to see the trace and audit dashboards running against a live agent pipeline.
Sources
For deeper technical grounding, consult the NIST AI agent standards research from Cloud Security Alliance, Microsoft’s guidance on composite agent performance measurement, and the BigQuery Agent Analytics SDK for hands-on trace schema examples. Engineers designing audit architecture should also review SOC 2 and EU AI Act audit patterns before finalising a schema.
- AI agent performance measurement (Microsoft blog)
- CSA research note — NIST AI agent standards initiative (Cloud Security Alliance labs)
FAQ
What is real-time agent analytics?
It’s live tracing, evaluation and alerting on what conversational AI agents actually do across voice, SMS, email and chat, covering latency, resolution rate, hallucination detection and compliance fields as conversations happen.
Why does composite scoring matter for agent performance?
A single metric can’t capture interaction quality, so a composite framework blending understanding, reasoning and delivery gives a clearer, more consistent benchmark, provided decomposed metrics stay available for diagnosis.
What latency target should voice agents hit?
Aim for 800 milliseconds or under, measured at p95 over a rolling 5-minute window rather than a daily average, since averages hide the spikes that frustrate callers.
Which metrics should block a deployment?
Task completion regressions, hallucination spikes and PII leaks belong in CI gates that stop a release; latency and escalation accuracy belong in SLOs that page on-call instead.
How does Conversational AI support live agent analytics?
Some platforms include built-in real-time analytics and CRM integration, giving enterprise teams trace capture, SLO dashboards and audit logging capabilities without needing to build that telemetry stack separately.