AI platform ROI explained: a practical guide for Australian enterprise leaders
Discover how to measure AI platform ROI effectively. This guide helps Australian leaders optimize costs and achieve real value from AI investments.

AI platform ROI is measurable, but only when you apply a full-cost denominator and credible attribution from the start. Most organisations that struggle to demonstrate value are not failing at technology — they are failing at measurement discipline. Gartner forecasts worldwide genAI spending to reach $644 billion in 2025, which makes robust cost allocation and ROI instrumentation an urgent priority for every Australian enterprise leader, not an afterthought.
Three things to act on before your next board meeting:
- Show the full denominator. Include inference costs, integration engineering, governance, change management, and — for Australian deployments — data-sovereignty hosting — a licence fee alone understates your investment by a wide margin.
- Measure one high-confidence use case first. Pick a process with a clear baseline, a short feedback loop, and a direct P&L line. Prove the method before scaling the claim.
- Lock in a governance step now. Classify your data, define your audit-log requirements, and confirm your hosting meets Australian Privacy Act obligations before you go to production.
Key takeaways
Measuring AI platform ROI is a discipline problem, not a technology problem — organisations that instrument early, define their full cost denominator, and apply credible attribution consistently are the ones that capture and defend durable value.
| Point | Details |
|---|---|
| Use the full cost denominator | Include inference, integration, governance, change management, and Australian data-sovereignty hosting — not just the licence fee. |
| Define your value hypothesis first | Write a one-sentence hypothesis with a named metric, a baseline, and a timeframe before any technical work begins. |
| Choose a credible attribution method | A clean holdout test or matched-market comparison is more persuasive to a CFO than a complex model they cannot audit. |
| Set kill/scale rules before the pilot | Define in advance what a failed pilot looks like and act on it — sunk cost is not a reason to continue an underperforming deployment. |
| Conversational AI for Australian enterprise | Conversational AI’s private, Australia-hosted platform captures interaction-level data from day one, supporting auditable ROI claims in regulated sectors. |
Table of Contents
- What “AI platform ROI” actually means and how it differs from standard IT ROI
- Why calculating AI platform ROI is unusually hard
- Core inputs: the complete cost and benefit checklist for your ROI model
- Which KPIs to track: operational, financial, and strategic metrics
- Practical frameworks and formulas you can use
- Attribution strategies and common modelling pitfalls to avoid
- A compact step-by-step model to build an AI platform ROI case for the board
- Typical costs, timelines, and benchmarks for enterprise AI platform projects
- Governance, responsible AI, and Australian legal considerations to protect ROI
- Practical Australian ROI examples and how a private Australia-hosted conversational AI platform delivers measurable value
- How to present AI platform ROI to the board or CFO
- Balancing ambition and discipline when investing in AI platforms
- Conversational AI: private, Australia-hosted, and built for measurable outcomes
- Sources
What “AI platform ROI” actually means and how it differs from standard IT ROI
The standard formula is straightforward: ROI = (verified net benefit ÷ fully loaded total cost of ownership) × 100. The discipline is in the words “verified” and “fully loaded.” PwC notes that most AI ROI failures are measurement problems rather than technology failures — organisations claim value they cannot trace to an auditable P&L line.
Traditional IT ROI typically covers a one-time capital expenditure, a predictable licence, and a stable maintenance fee. AI platform ROI is structurally different in three ways:
- Recurring inference costs scale with usage volume, not with headcount or seat licences, and can spike unpredictably when a new use case goes live.
- Model churn and prompt maintenance add ongoing engineering effort that rarely appears in the original business case.
- Governance and adoption costs — model evaluation, drift monitoring, change management, and compliance overhead — are first-order cost lines, not optional extras
Time horizon matters too. A quarterly board review is appropriate for operational KPIs and cost-takeout metrics. Strategic metrics — capability creation, competitive positioning, governance maturity — need an annual cadence. Conflating the two leads to either premature disappointment or inflated claims.
Why calculating AI platform ROI is unusually hard
Attribution is the central problem. AI often touches multiple steps in a customer journey or a workflow, making it genuinely difficult to isolate its contribution from other changes happening simultaneously. A contact centre that deploys an AI agent while also retraining staff and updating its CRM cannot cleanly separate the three effects without a deliberate experimental design.
Hidden costs compound the problem. Practitioners report that pilot-to-production cost increases — covering inference, integration, and maintenance — frequently run 2–5 times the initial tool licence. A pilot running on a vendor’s shared infrastructure at a fixed monthly fee looks very different from a production deployment with dedicated hosting, security controls, and a live integration to your CRM and telephony stack.
Time-lagged value adds another layer of difficulty. Productivity gains from AI often take 6–12 months to show up in financial outcomes because staff need time to change workflows, and managers need time to redeploy capacity. Model and pricing volatility — vendor price changes, model deprecations, API restructures — can shift your cost base mid-year without warning.
The Wharton 2025 AI adoption report confirms that while many organisations have deployed AI in at least one function, a minority can reliably measure ROI. Measurement discipline is what separates those that capture value from those that generate activity without auditable outcomes.
Core inputs: the complete cost and benefit checklist for your ROI model
Never build a business case without accounting for every line below.
Cost lines:
- Tool licence and platform subscription fees
- Inference and API consumption costs (token-based or call-based, at production volume)
- Integration engineering (CRM, telephony, data pipelines, legacy system connectors — see AI integration with legacy systems for realistic effort estimates)
- Data pipeline setup and ongoing maintenance
- Model evaluation, monitoring, and drift remediation
- Security controls, access management, and audit logging
- Governance and compliance overhead (especially in regulated sectors)
- Change management, training, and adoption support
- Vendor professional services and implementation fees
- Hosting — and for Australian deployments, the data-sovereignty premium for private cloud infrastructure within Australian borders
Benefit types (mapped to the Shopify four-bucket model):
- Revenue lift: new pipeline generated, conversion rate improvement, upsell and cross-sell from AI-assisted interactions
- Cost takeout: reduced headcount cost per transaction, lower cost per ticket, fewer escalations
- Velocity and throughput: faster cycle times, higher volume handled per agent-hour, reduced time-to-resolution
- Risk and quality: error reduction, compliance breach avoidance, improved audit outcomes
For each line, define a micro-metric that finance can map to a P&L or unit economics model. “Productivity improvement” is not a P&L line. “Reduction in average handle time from 8.2 minutes to 5.4 minutes across 12,000 monthly interactions, at a fully loaded agent cost of $X per minute” is.
Which KPIs to track: operational, financial, and strategic metrics
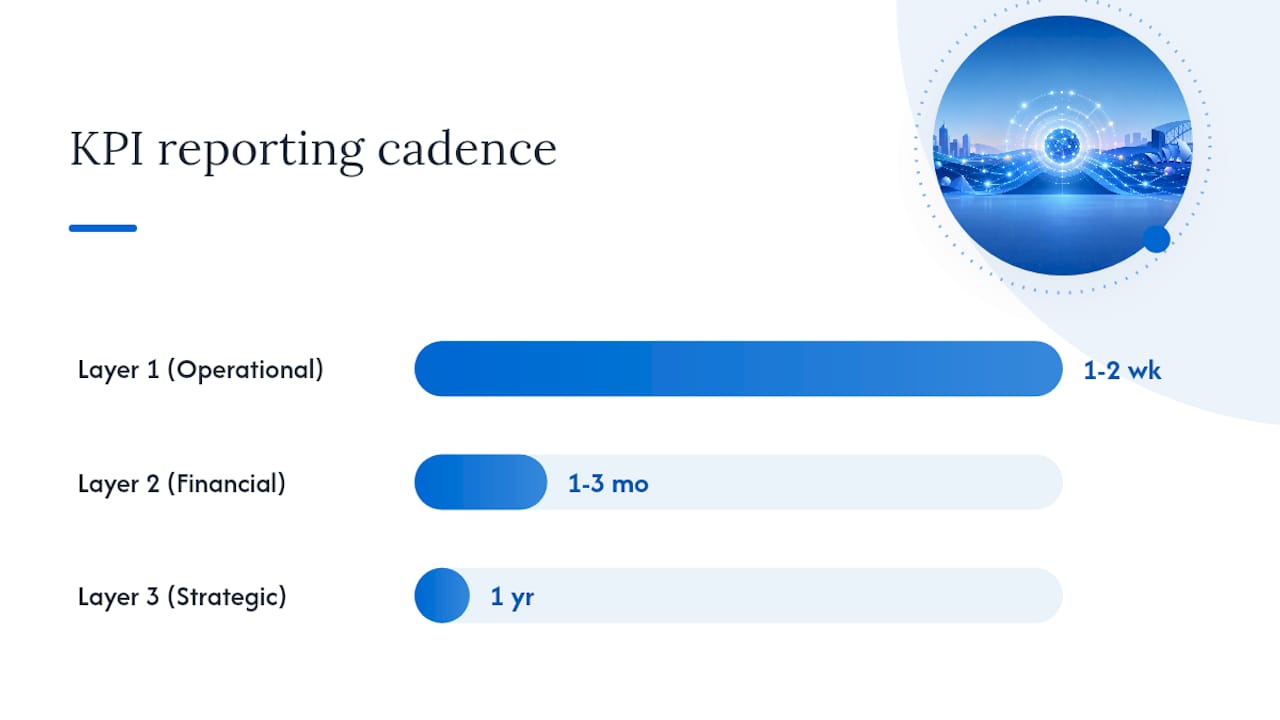
A layered KPI model keeps board reporting clean and prevents operational noise from drowning out financial signal.
Layer 1 — Operational/unit metrics (weekly or fortnightly):
- Average handle time and first-contact resolution rate
- AI containment rate (interactions resolved without human escalation)
- Cost per interaction or cost per ticket
- Throughput volume handled by AI vs. human agents
Layer 2 — Financial outcomes (monthly or quarterly):
- Cost takeout in dollars (not percentages alone)
- Revenue attributed to AI-assisted interactions (with attribution method stated)
- Payback period progress against plan
Layer 3 — Capability and strategic metrics (annually):
- Governance maturity score
- Data quality and model accuracy trends
- Competitive capability indicators (time-to-market for new use cases)
| KPI | Calculation | Typical data source |
|---|---|---|
| AI containment rate | AI-resolved interactions ÷ total interactions × 100 | Contact centre platform telemetry |
| Cost per interaction | Fully loaded operational cost ÷ total interactions | Finance + CRM |
| Revenue lift per AI interaction | Incremental revenue in AI-assisted cohort vs. control | CRM + A/B test logs |
| Average handle time reduction | Baseline AHT minus post-deployment AHT | Contact centre platform |
| Error/rework rate | Rework incidents ÷ total transactions processed | Operations or quality system |
Instrumentation checklist:
- Tag every AI-touched interaction at the session level so you can segment it cleanly in your analytics platform
- Establish frozen baselines before go-live — not retrospectively
- Use control groups or matched-market comparisons wherever possible
- Maintain audit logs that satisfy both internal governance and Australian Privacy Act requirements
- Review instrumentation design with your finance team before launch, not after
CRM AI synchronisation is often the critical integration point for Layer 1 and Layer 2 data — if your CRM and AI platform are not logging at the interaction level, your KPI data will have gaps that undermine board credibility.
Practical frameworks and formulas you can use
Goldman Sachs advises treating AI as an ongoing operational discipline and sequencing financial and strategic metrics on different cadences. The formulas below give you the calculation routes; the sensitivity table makes your assumptions explicit for finance reviewers.
Canonical formulas:
- ROI = (Net benefit ÷ Total cost of ownership) × 100. Apply a 3× haircut to any napkin estimate unless you have verified baselines and a credible attribution method.
- Net present value (NPV) = Sum of (annual net benefit ÷ (1 + discount rate)^year) minus initial investment. Use a discount rate consistent with your organisation’s hurdle rate — typically 8–12% for Australian enterprise.
- Payback period = Total investment ÷ annual net benefit. For most enterprise AI deployments, a payback period under 18 months is achievable for structured automation; agentic workflows often run 24–36 months.
- Internal rate of return (IRR) = The discount rate at which NPV equals zero. Useful for comparing AI initiatives against other capital allocation options.
- Total Economic Impact (TEI) adjustments: add risk adjustment factors (typically 0.6–0.8 for unproven use cases) and flexibility value (option value of capabilities that enable future initiatives).
Sample NPV sensitivity — contact centre AI agent (illustrative):
Note: figures are illustrative only. Replace with your verified baseline data before presenting to a board.
The CloudZero four-step framework — see the full investment, define the numerator before launch, bridge with unit economics, review with kill/scale rules — maps directly onto these formulas. The most common failure is skipping step one: if you cannot allocate spending to individual initiatives, you cannot compute ROI reliably.
Pro Tip: Divide your initial napkin ROI estimate by three before presenting it to finance. That single adjustment accounts for adoption shortfalls, accuracy haircuts, and hidden cost lines that almost always emerge between pilot and production.
Attribution strategies and common modelling pitfalls to avoid
Choosing the right attribution method is as important as choosing the right formula. MIT Sloan’s research on scaling AI makes clear that measurement without integration and adoption rarely yields sustained ROI — attribution is where that gap shows up most visibly.
Experiment options, from strongest to most pragmatic:
- Randomised A/B test — assign interactions or customers randomly to AI-assisted and non-AI-assisted groups. Strongest causal evidence; feasible for high-volume digital channels.
- Holdout group — keep a defined percentage of interactions on the legacy process for a set period. Practical for contact centres and outbound campaigns.
- Matched-market comparison — compare two similar business units, regions, or customer segments where one has deployed AI and one has not. Useful when randomisation is operationally difficult.
- Time-series baselining — freeze a pre-deployment baseline and compare post-deployment performance against it, controlling for seasonal and external factors.
- Synthetic control — construct a statistical counterfactual from historical data when none of the above is feasible. Credible but requires analytical resource.
When A/B tests are unfeasible, matched-market comparisons and time-boxed pilots with frozen baselines are the most credible alternatives available to most Australian enterprise teams.
Common pitfalls:
- Extrapolating pilot results to full production without adjusting for volume, edge cases, and integration complexity.
- Ignoring substitution effects — when AI handles routine queries, human agents often shift to harder cases, which can increase average handle time for the remaining human interactions.
- Omitting organisational costs — change management, retraining, and process redesign are real costs that belong in the denominator.
- Conflating usage metrics with value metrics — a high AI containment rate is not the same as a verified cost reduction unless you can trace it to a P&L line.
Pro Tip: *Choose the simplest attribution method that your finance team will accept as credible.
A compact step-by-step model to build an AI platform ROI case for the board
Steps from scoping to board review:
- Define a value hypothesis. One sentence: “If we deploy AI to handle X% of [process], we expect to reduce [cost line] by $Y within [timeframe], measured by [metric].”
- Establish your baseline. Freeze current-state metrics before any deployment. Retrospective baselines are almost always challenged.
- Map the full cost denominator. Use the checklist in the inputs section. Include hosting, governance, and change management from day one.
- Design your instrumentation. Tag interactions, set up logging, confirm your data pipeline to the analytics layer, and get finance sign-off on the measurement approach.
- Run a time-boxed pilot. Six to eight weeks is typically enough for structured automation use cases. Define success criteria and kill/scale thresholds before you start.
- Measure against the baseline. Apply your chosen attribution method. Adjust for adoption rate and accuracy haircuts.
- Present to the board with a kill/scale decision. One-page value hypothesis, baseline evidence, measured results, sensitivity range, and the ask.
- Set a review cadence. Quarterly for financial metrics; annually for strategic and governance metrics.
Prioritisation matrix — pick your first 2–3 initiatives:
- High impact × high ease × short time to value: structured automation of high-volume, rules-based processes (e.g., appointment booking, FAQ handling, collections outreach). Start here.
- High impact × lower ease × medium time to value: productivity copilots for knowledge workers or sales teams. Second priority.
- High strategic value × long time to value: agentic workflows and capability-building initiatives. Plan these in parallel but do not count on them for near-term ROI.
Board presentation tips:
- Lead with the one-line verdict and the dollar figure, not the technology description.
- Show the baseline evidence first — boards trust measurement more when they can see what you measured against.
- State your kill/scale rules explicitly: “If containment rate is below X% at 90 days, we pause and diagnose before scaling.”
- The ask should be specific: a budget figure, a headcount commitment, or a procurement decision — not a vague “continued support.”
Typical costs, timelines, and benchmarks for enterprise AI platform projects
Realistic expectations prevent the disappointment that kills AI programmes after the first review cycle.
| Use case type | Typical time to first value | Payback range | Notes |
|---|---|---|---|
| Structured automation (FAQ, booking, collections) | 6–12 weeks | under 18 months | Fastest ROI; clearest attribution |
| Productivity copilot (sales, service, knowledge) | 3–6 months | 12–24 months | Adoption curve is the main variable |
| Agentic workflows (multi-step, cross-system) | 6–12 months | 24–36 months | Highest upside; highest integration cost |
Cost-range notes (fully loaded):
- A structured automation pilot typically runs $30,000–$80,000 fully loaded, including integration, governance setup, and a modest change management effort.
- A production rollout for a mid-sized Australian enterprise commonly runs $150,000–$500,000 in year one, depending on integration complexity and data-sovereignty hosting requirements.
- Enterprise-scale deployments with multichannel automation, CRM integration, and regulated-sector compliance can exceed $1 million annually in total cost of ownership.
Australia-specific considerations:
- Data-sovereignty hosting within Australian borders adds a cost premium over offshore cloud, but it is non-negotiable for healthcare, finance, and government sectors under the Australian Privacy Act and sector-specific regulations.
- Procurement lead times in Australian enterprise — particularly in regulated sectors — often add 4–8 weeks to a deployment timeline. Factor this into your payback calculation.
- Regulated-sector governance overheads (audit logging, model evaluation, incident response documentation) add 15–25% to ongoing operational costs compared with unregulated deployments.
For practical guidance on AI automation for Australian businesses, including sector-specific cost and benefit examples, the deployment context matters as much as the technology choice.
Governance, responsible AI, and Australian legal considerations to protect ROI
Governance is not a compliance checkbox — it is a direct ROI protection mechanism. A model that drifts, a data breach, or a regulatory finding can erase months of cost savings in a single incident.
Governance checklist:
- Classify all data the AI platform will access or process, and confirm classification against your Australian Privacy Act obligations before go-live
- Implement role-based access controls and maintain audit logs at the interaction level
- Schedule regular model evaluation cycles — at minimum quarterly — to detect accuracy drift before it affects customer outcomes
- Define an incident response protocol that covers AI-specific failure modes (hallucination, bias, data leakage)
- Maintain a model and vendor register so you can respond quickly to model deprecations or price changes
Regulatory touchpoints for Australian enterprises:
- The Privacy Act 1988 (Cth) and the Australian Privacy Principles govern how personal information is collected, stored, and processed — AI platforms that handle customer data must comply
- The Australian Signals Directorate’s Essential Eight framework provides a practical baseline for AI platform security controls
- Sector-specific obligations apply in healthcare (My Health Records Act, state health privacy legislation), finance (APRA prudential standards), and government (data sovereignty and procurement policy)
- Hosting data within Australia is not just a preference in regulated sectors — it is often a contractual or regulatory requirement
Sample procurement clauses to include in AI platform contracts:
- Model stability clause: vendor must provide 90 days’ notice of any model deprecation or material change to inference pricing
- Data residency clause: all data processing and storage must occur within Australian jurisdiction
- Audit rights clause: client retains the right to audit model evaluation logs and access controls on reasonable notice
- Maintenance responsibility clause: vendor is responsible for security patching and model updates within agreed SLA windows
ISACA’s guidance on measuring and proving AI investment value provides a governance checklist that boards find credible when reviewing AI risk and value simultaneously. For private AI deployment best practices, the governance architecture decisions made at deployment time are far cheaper to get right than to retrofit later.
Practical Australian ROI examples and how a private Australia-hosted conversational AI platform delivers measurable value
Case example 1 — Financial services, outbound collections automation
A mid-sized Australian financial services firm deployed a multichannel AI agent to handle outbound collections calls and SMS follow-ups. The attribution method was a clean holdout comparison with frozen baselines. Payback on the fully loaded pilot cost was reached at month seven of production.
Case example 2 — Healthcare administration, appointment booking and triage
A private healthcare network across three Australian states deployed a voice and SMS AI agent for appointment booking and initial triage routing. The attribution method was time-series baselining with a seasonal adjustment for the winter demand period. The network also avoided a planned headcount increase of three FTE, which represented the largest single cost-avoidance item in the ROI model.
Implementation playbook:
- Scope: define the use case, the value hypothesis, and the baseline metrics before any technical work begins
- Integrate: connect the AI platform to your CRM, telephony, and data systems — contact centre AI integration is typically the longest lead-time item
- Instrument: tag interactions, set up logging, and confirm the data pipeline to your analytics layer
- Measure: apply your chosen attribution method against the frozen baseline at the agreed review point
- Govern: activate audit logging, schedule model evaluation cycles, and confirm data-sovereignty hosting is live before go-live
Research on equity markets suggests an AI premium linked to frontier and intensive AI usage, indicating that strategic value from AI accrues beyond what short-term ROI metrics capture. This is a reason to track capability and governance maturity alongside financial returns — not to replace financial discipline, but to give the board a complete picture.
How to present AI platform ROI to the board or CFO
The structure of your presentation matters as much as the numbers in it. A CFO who cannot audit your methodology will discount your claim regardless of the dollar figure.
Recommended slide outline:
- Slide 1 — One-line verdict: “Our AI deployment reduced cost per interaction by X% and is on track to pay back within Y months.”
- Slide 2 — Value hypothesis: One page. The use case, the baseline, the expected benefit, the cost denominator, and the attribution method.
- Slide 3 — Baseline evidence: Show the pre-deployment metrics with data sources and the date the baseline was frozen.
- Slide 4 — Measured results: Post-deployment metrics against the baseline, with the attribution method stated and the confidence level noted.
- Slide 5 — Sensitivity analysis: A simple three-scenario table (conservative, base, optimistic) showing how results change with adoption and accuracy assumptions.
- Slide 6 — Ask and governance: The specific ask (budget, headcount, procurement decision), the kill/scale rules, and the governance controls in place.
Visual templates that work:
- Unit-economics chart: cost per interaction over time, with AI-handled and human-handled cohorts shown separately
- Payback waterfall: cumulative cost vs. cumulative benefit by month, with the payback crossover point marked
- Sensitivity tornado chart: shows which assumptions (adoption rate, accuracy, inference cost) have the largest impact on NPV
- Instrumentation pedigree diagram: a one-page flow showing where data is captured, how it flows to the analytics layer, and who has audit access
Narrative bullets that link operational metrics to P&L impact:
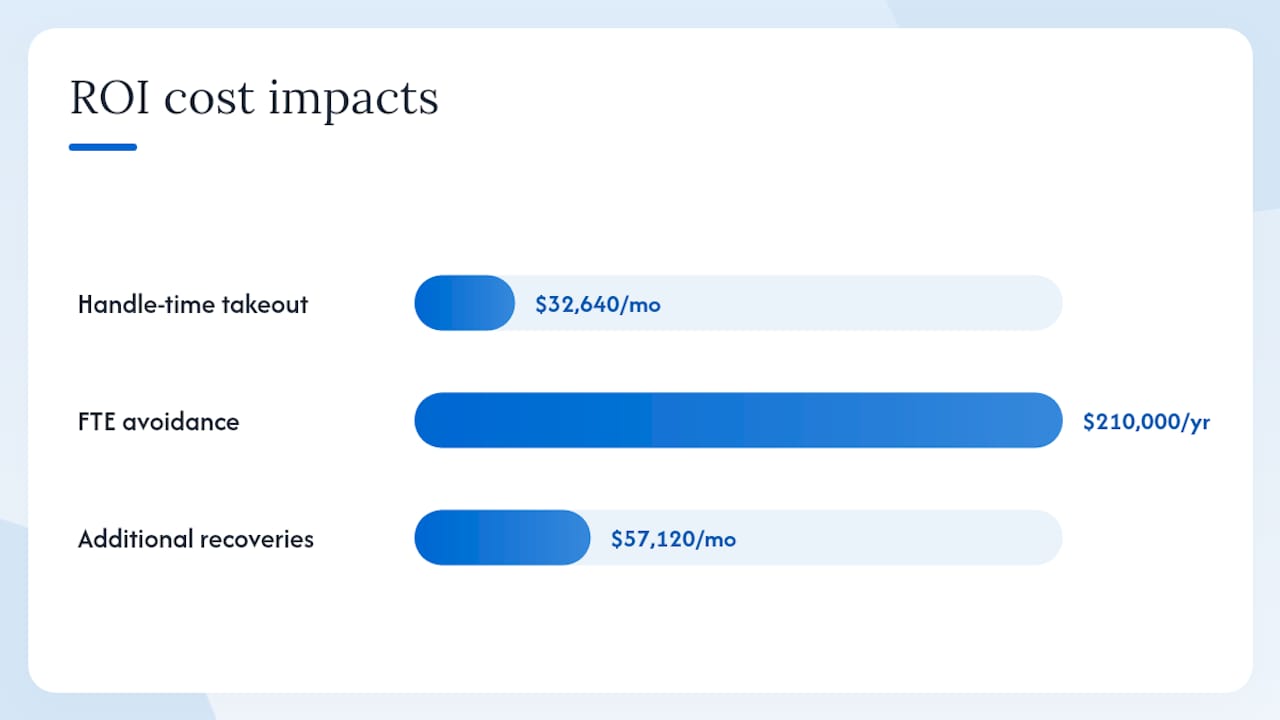
- “A 3.2-minute reduction in average handle time across 12,000 monthly interactions, at a fully loaded agent cost of $0.85 per minute, represents $32,640 in monthly cost takeout.”
- “AI containment of 61% of inbound calls avoided a planned FTE increase, representing $210,000 in annual cost avoidance at current award rates.”
- “Right-party contact rate improvement of 4 percentage points on 4,200 monthly collections contacts, at an average recovery value of $340 per successful contact, represents $57,120 in additional monthly recoveries.”
Measuring AI platform ROI with this level of specificity is what separates a board-ready business case from a technology pitch.
Balancing ambition and discipline when investing in AI platforms
The most persistent mistake I see in AI investment discussions is treating the ROI question as a technology problem. It is not. The technology works. The measurement discipline is what fails.
Organisations that capture durable value from AI platforms share three habits. They instrument before they deploy — not after. They prioritise unit economics over headline capability claims, which means they can tell you the cost per interaction, the cost per lead qualified, or the cost per appointment booked, not just the percentage of tasks “automated.” And they enforce kill/scale discipline: they define in advance what a failed pilot looks like and they act on it, rather than letting underperforming deployments run indefinitely because the sunk cost feels too large to write off.
The cautionary notes are worth stating plainly. Vendor lock-in is a real risk when your AI platform becomes the integration layer for your CRM, telephony, and data systems — the switching cost grows with every integration you add. Scale amplifies both value and cost, so a unit economics model that looks attractive at pilot volume can deteriorate at production scale if inference costs are not capped or if adoption plateaus below the break-even threshold. And valuation expectations — the idea that AI capability alone will be rewarded by markets or by internal capital allocation — are not a substitute for auditable P&L impact.
Treat AI as an operational discipline. Sequence your metrics. Report financial outcomes quarterly and strategic outcomes annually, as Goldman Sachs recommends. And never present a benefit claim to a board that you cannot trace to a data source your CFO can audit.
Conversational AI: private, Australia-hosted, and built for measurable outcomes
The measurement problems described throughout this article — hidden costs, attribution gaps, data-sovereignty risk, governance overhead — are exactly what a private, Australia-hosted deployment is designed to address. Conversational AI hosts entirely within Australian borders, which removes the data-sovereignty compliance risk that adds cost and delay to offshore deployments in healthcare, finance, and regulated services.
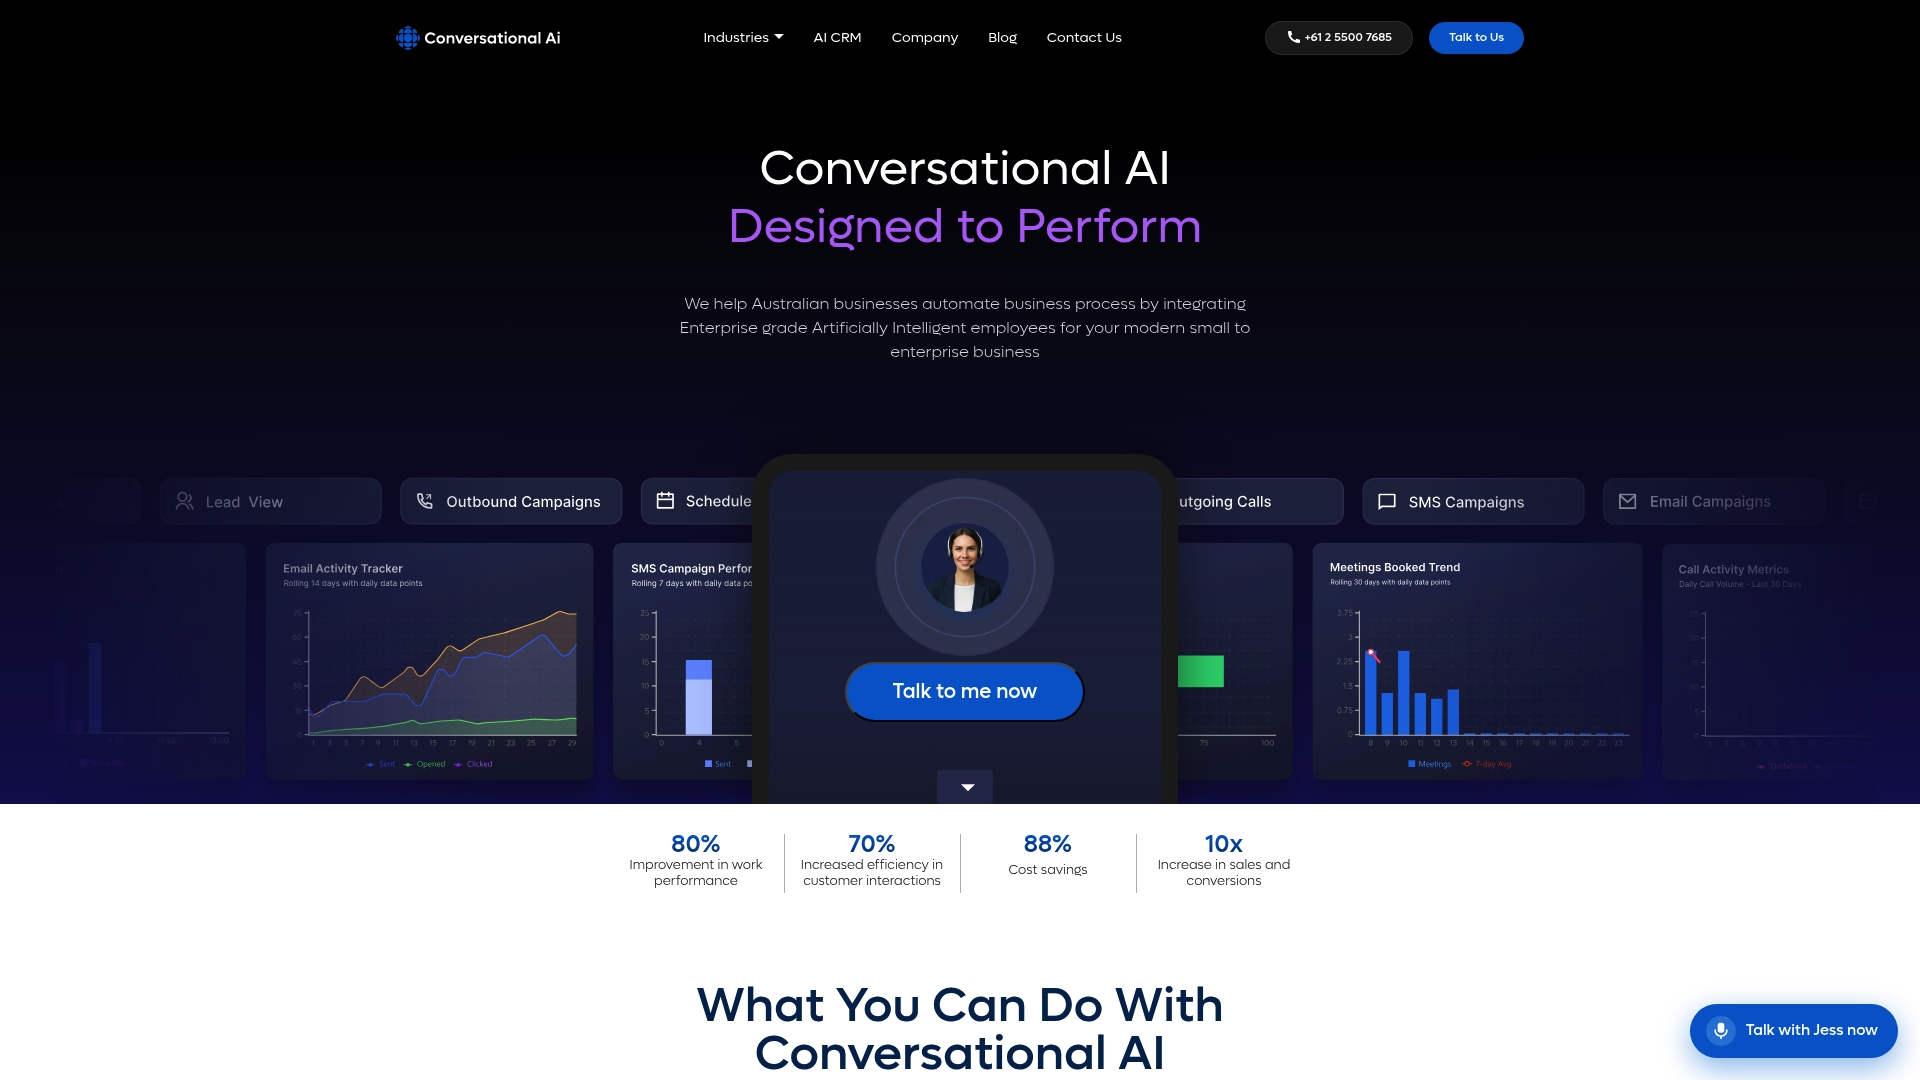
The platform’s multichannel AI agents — voice, SMS, email, and live chat — integrate directly with your CRM and existing infrastructure, so the interaction-level data your ROI model needs is captured from day one, not retrofitted. Agentic reporting and real-time analytics give your finance team the audit trail they need to verify cost takeout and revenue lift claims. For Australian enterprise leaders who need a board-ready business case, not just a technology pilot, Conversational AI offers a proof-of-value engagement with instrumentation and measurement support built in. Book a consultation to scope your first use case and establish the baseline your ROI model requires.
Sources
- Gartner forecasts worldwide genAI spending to reach $644 billion in 2025
- Scaling AI results: strategies (MIT Sloan)
- Defining and measuring return on investment for AI: PwC